
Delta Robot ROI: How to Estimate Payback for a Pick-and-Place Cell
By Omar Abdulhadi, PhD · October 12, 2026
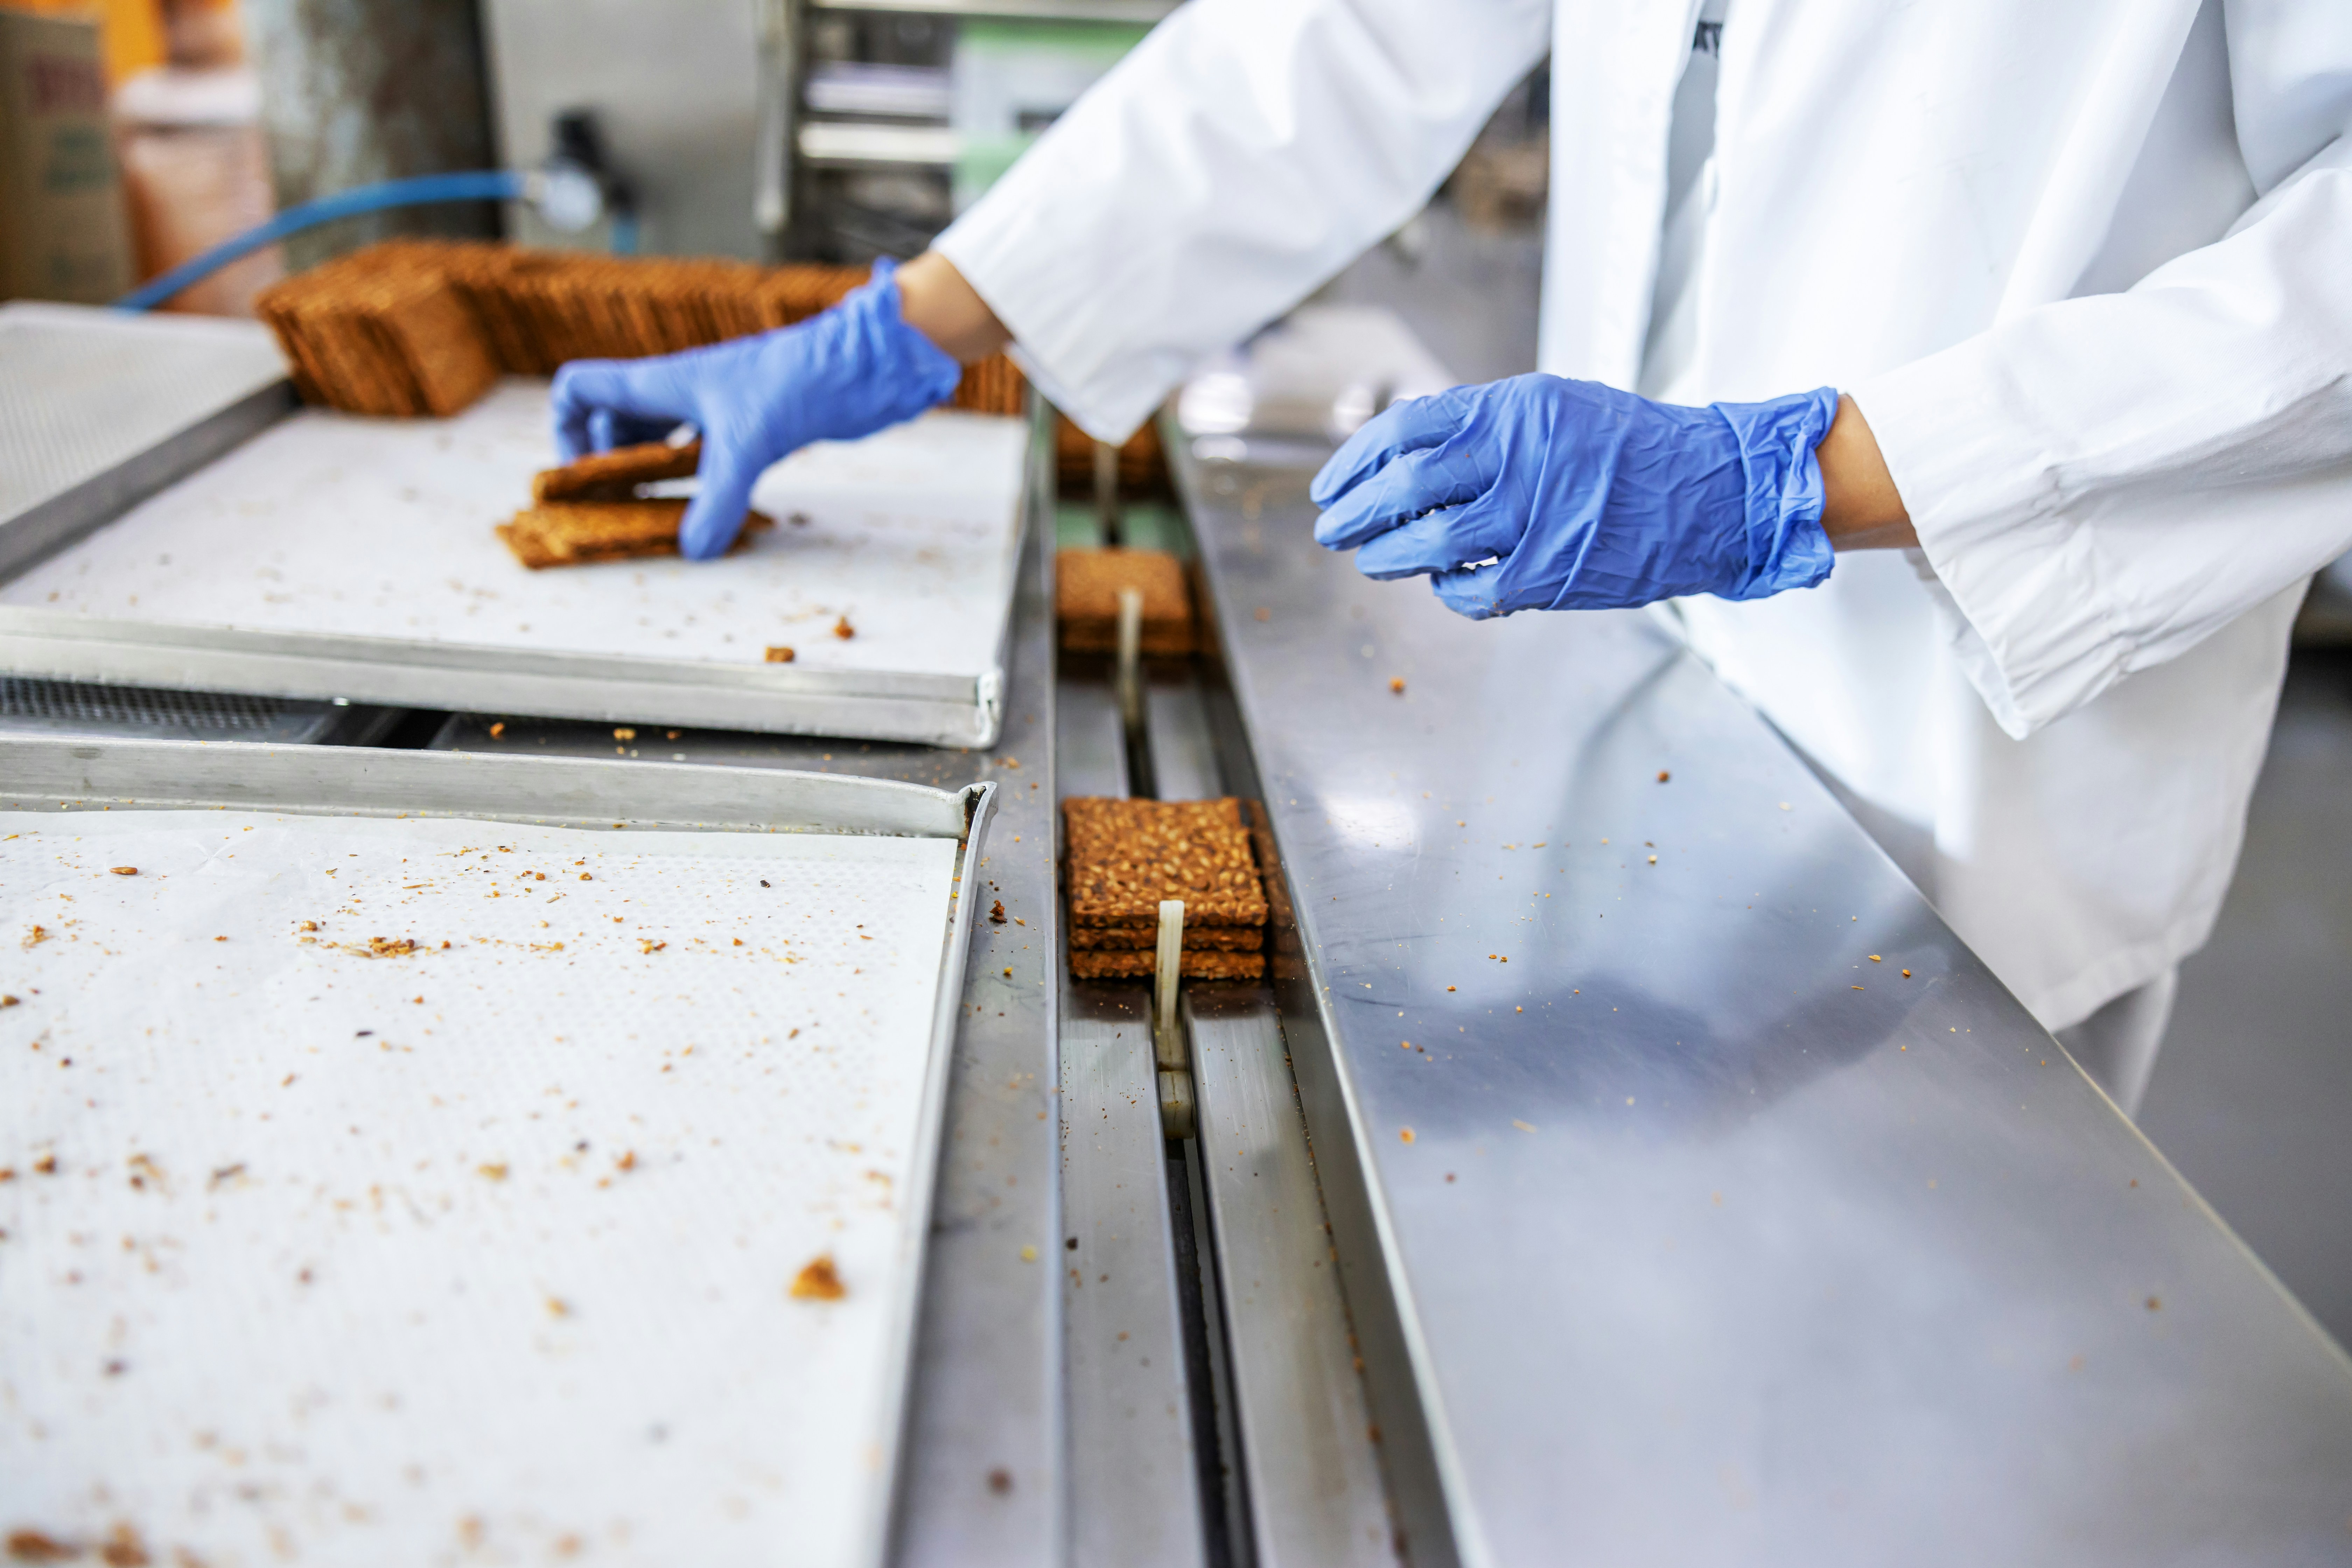
Every pick-and-place automation project eventually lands on the same question from finance: when does it pay for itself? A vendor brochure won’t give you a good answer, and neither will a calculator that hides its math. What works is a simple model that uses your own line’s numbers.
This article walks through a practical way to estimate delta robot ROI for a pick-and-place cell. It covers the inputs worth collecting, the payback formula, a worked example, and the factors that often decide whether a project hits its target.
The Inputs That Drive Pick and Place Automation ROI
Before any formula, collect these numbers from the line you want to automate. Use your own data wherever you can and published benchmarks only to sanity-check it.
| Input | What to measure | Why it matters |
|---|---|---|
| Labor cost per shift | Fully loaded hourly cost (wages, benefits, overhead) × workers on the task | Usually the largest line in the savings |
| Shifts and operating days | Shifts per day, days per year | Multiplies every hourly saving |
| Required pick rate | Picks per minute the line has to sustain | Sets how many workers or robots you need |
| Manual pick rate | Sustained picks per minute per worker, not the peak | Turns the required rate into headcount |
| Uptime | Share of scheduled time the cell actually runs | Determines real capacity |
| Scrap and rework | Percentage of product damaged, misplaced, or reworked | Often an overlooked saving |
| Integration and commissioning effort | Engineering hours, travel, and lost production during start-up | A real cost that belongs in the investment |
On manual pick rate, measure across a full shift. Food and beverage benchmarks compiled on our food and beverage industry page put manual picking at 14–20 picks per minute per worker, declining to about 14 by the end of a shift (sources: PMMI, AMD Machines, Food Engineering Magazine). If you time a worker in the first hour, you will overstate what manual labor delivers and understate what automation saves.
The Delta Robot Payback Formula
Keep the model transparent. Annual net benefit is the sum of the savings, minus what the cell costs to run:
- Labor savings = (workers removed per shift − operator time added per shift) × shifts × loaded hourly cost × hours per shift × operating days
- Scrap savings = annual units × (manual scrap rate − automated scrap rate) × value per unit
- Operating cost = annual maintenance, spare parts, and energy for the cell
- Annual net benefit = labor savings + scrap savings − operating cost
Then:
- Payback (months) = total installed investment ÷ (annual net benefit ÷ 12)
“Total installed investment” means everything needed to run in production: robot, controller, tooling, vision, guarding, integration labor, and the cost of downtime during commissioning. Ask every vendor for an all-in figure so you compare like with like.
Throughput gains and labor-turnover costs are real, but they are harder to defend in a budget meeting. Start with labor and scrap, and treat everything else as upside.
A Worked Example
The inputs below are hypothetical and for illustration only. They are not quotes, benchmarks for your line, or Adeeb pricing. Swap in your own numbers.
Hypothetical line: a food line that needs to place 60 products per minute into trays, running two 8-hour shifts, 250 days a year.
- Manual staffing: at a sustained 15 picks per minute per worker, 60 picks per minute needs 4 workers per shift.
- Loaded labor cost: $22 per hour.
- Operator time after automation: one operator shared across two cells, so 0.5 operator per shift.
- Scrap: 3% manual, assumed 1% automated, at $0.25 of value per unit.
- Operating cost: $15,000 per year for maintenance, spares, and energy.
Labor savings: (4 − 0.5) × 2 shifts × $22 × 8 hours × 250 days = $308,000 per year
Scrap savings: 60 units/min × 60 × 8 × 2 × 250 = 14.4 million units a year. A 2-point scrap reduction saves 288,000 units × $0.25 = $72,000 per year
Annual net benefit: $308,000 + $72,000 − $15,000 = $365,000, or about $30,400 per month.
Payback in months is the installed investment divided by $30,400. Turn it around to set a budget: in this hypothetical, a cell with an all-in cost of about $365,000 pays back in 12 months, and one at about $548,000 pays back in 18. Plug in a real quote and you have a payback figure you can defend line by line.
Check capacity against uptime. If the cell runs 95% of scheduled time, it has to be capable of at least 63 picks per minute to average 60. The Adeeb Delta Robot is rated for 100+ picks per minute (25 g payload, 305 mm travel), which leaves headroom. Always confirm the rate on your actual product, though, because product size, spacing, and gripping all change real cycle times.
Compare to published ranges. Our industry benchmarks show a typical payback of 10–18 months for robotic automation in food and beverage (sources: PMMI, AMD Machines, Food Engineering Magazine) and 12–18 months for robotic recycling sorting (sources: AMP Robotics, EverestLabs, Recycleye, Robotics 24/7). If your model comes out far outside those ranges, check your inputs again.
The Less Obvious Factors in Delta Robot ROI
The headline inputs get most of the attention. These three often decide whether a project actually hits its payback date.
Self-commissioning shortens time to value
Every week between delivery and production is a week of investment with no return. Integration effort is the input buyers most often underestimate. In our recycling case study, the customer’s own team wrote the sorting logic in Python. RePlastic Recycle assembled, installed, and commissioned their system from the documentation alone, without an Adeeb representative on site. When your team can commission the cell itself, you avoid paying for travel and you don’t wait on a vendor’s schedule.
Remote support protects uptime
A 95% uptime assumption only holds if problems get solved fast. Ask how support works: same-day answers over video, or a ticket and a site visit next week? RePlastic Recycle described our remote support as “rapid and clear to the point.” Every hour of downtime you avoid is an hour of savings you keep.
Changeovers count on mixed-product lines
If the line runs several SKUs, each changeover is lost production. Count changeovers per week and minutes per changeover. The Delta Robot’s quick-change tooling supports a tool-less end-effector swap in under 30 seconds, which keeps that loss small. If you’re still choosing an architecture, see our comparison of delta robots vs. traditional robots for pick and place.
FAQ
What is a typical payback period for a delta robot?
It depends on labor cost, shifts, and scrap. Published industry benchmarks show 10–18 months for food and beverage automation and 12–18 months for recycling sorting.
Should I count throughput gains in my ROI?
Only if you can sell the extra output. If demand is fixed, count labor and scrap savings and treat added capacity as upside.
What’s the most commonly underestimated cost?
Integration and commissioning. Include engineering hours, travel, and lost production during start-up in the investment, and ask vendors whether your team can commission the cell itself.
Get a Payback Estimate for Your Line
The fastest way to firm up your numbers is to test them against a real cell. Explore the Adeeb Delta Robot, book a demo to see it on product like yours, or contact our engineers to walk through your inputs and build a payback model for your line.